


说明:文末提供完整示例代码下载。
本指南补充 legend 的文档字符串,继续阅读前,请先阅读该 API 文档。
为避免歧义,先定义几个常用术语:
- 图例条目(legend entry):图例由一个或多个条目组成,每个条目恰好包含一个图例键和一个标签。
- 图例键(legend key):标签左侧带颜色或图案的标记。
- 图例标签(legend label):描述图例键所代表句柄的文字。
- 图例句柄(legend handle):用于生成适当图例条目的原始对象。
控制图例条目
不带参数调用 legend(),会自动取得句柄和关联标签,等价于:
handles, labels = ax.get_legend_handles_labels()
ax.legend(handles, labels)
get_legend_handles_labels() 返回 Axes 上可以用于生成图例条目的句柄或 Artist 列表。但并非所有 Artist 都能直接加入图例,必要时需创建代理对象,详见下文。
注意:标签为空字符串,或以 _ 开头的 Artist 会被忽略。
要完全控制图例内容,通常直接向 legend() 传入合适的句柄:
fig, ax = plt.subplots()
line_up, = ax.plot([1, 2, 3], label='Line 2')
line_down, = ax.plot([3, 2, 1], label='Line 1')
ax.legend(handles=[line_up, line_down])
重命名图例条目
无法直接在句柄上设置标签时,可以将标签传给 Axes.legend:
fig, ax = plt.subplots()
line_up, = ax.plot([1, 2, 3], label='Line 2')
line_down, = ax.plot([3, 2, 1], label='Line 1')
ax.legend([line_up, line_down], ['Line Up', 'Line Down'])
如果不能直接访问句柄,例如使用某些第三方包时,可以通过 Axes.get_legend_handles_labels 获取。下面用字典重命名已有标签:
my_map = {'Line Up':'Up', 'Line Down':'Down'}

handles, labels = ax.get_legend_handles_labels()
ax.legend(handles, [my_map[l] for l in labels])
专门为图例创建 Artist,也称代理 Artist
不是所有句柄都能自动转为图例条目,因此经常需要另建一个可用的 Artist。图例句柄不必真的出现在 Figure 或 Axes 上。
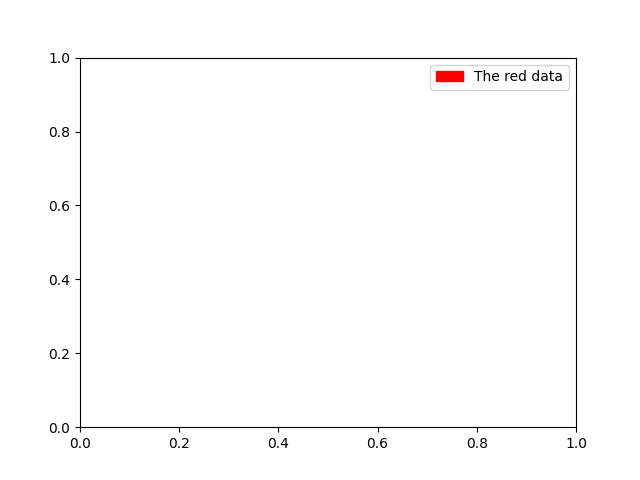
假设希望为用红色表示的数据创建一个图例条目:
import matplotlib.pyplot as plt

import matplotlib.patches as mpatches

fig, ax = plt.subplots()
red_patch = mpatches.Patch(color='red', label='The red data')
ax.legend(handles=[red_patch])

plt.show()
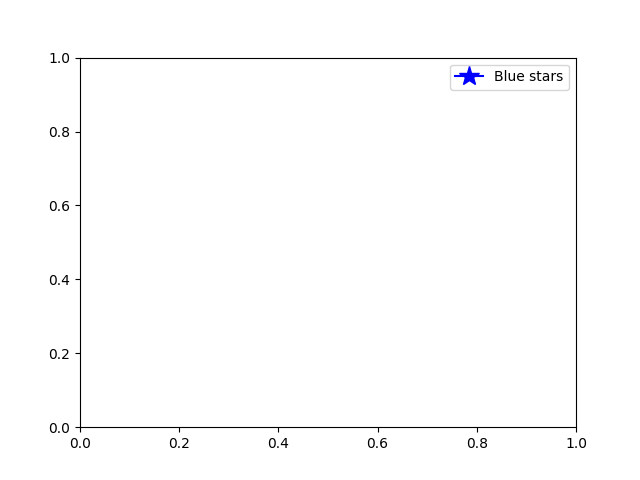
图例支持很多句柄类型。除了创建色块,也可以创建带标记的线:
import matplotlib.lines as mlines

fig, ax = plt.subplots()
blue_line = mlines.Line2D([], [], color='blue', marker='*',
                          markersize=15, label='Blue stars')
ax.legend(handles=[blue_line])

plt.show()
图例位置
通过关键字参数 loc 指定位置,详情见 legend() 文档。
bbox_to_anchor 提供更灵活的手动定位。例如,希望 Axes 的图例位于整个 Figure 右上角,而不是 Axes 右上角,只需指定角点坐标及坐标系:
ax.legend(bbox_to_anchor=(1, 1),
          bbox_transform=fig.transFigure)
更多自定义位置示例:
fig, ax_dict = plt.subplot_mosaic([['top', 'top'], ['bottom', 'BLANK']],
                                  empty_sentinel="BLANK")
ax_dict['top'].plot([1, 2, 3], label="test1")
ax_dict['top'].plot([3, 2, 1], label="test2")
# Place a legend above this subplot, expanding itself to
# fully use the given bounding box.
ax_dict['top'].legend(bbox_to_anchor=(0., 1.02, 1., .102), loc='lower left',
                      ncols=2, mode="expand", borderaxespad=0.)

ax_dict['bottom'].plot([1, 2, 3], label="test1")
ax_dict['bottom'].plot([3, 2, 1], label="test2")
# Place a legend to the right of this smaller subplot.
ax_dict['bottom'].legend(bbox_to_anchor=(1.05, 1),
                         loc='upper left', borderaxespad=0.)
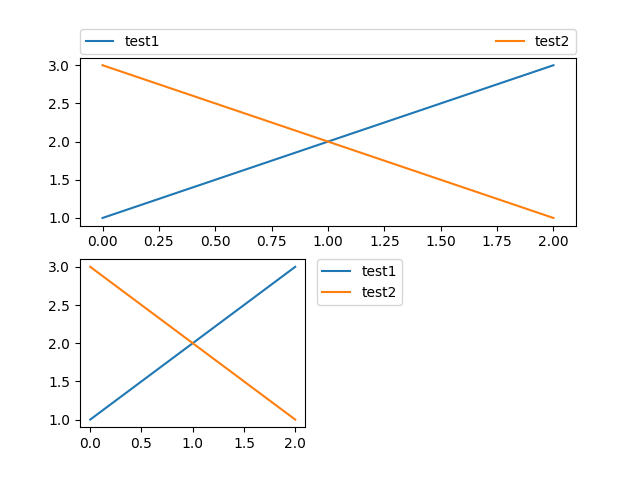
Figure 图例
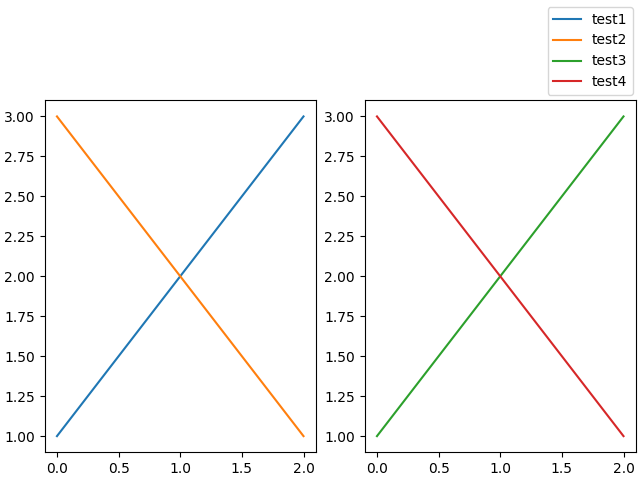
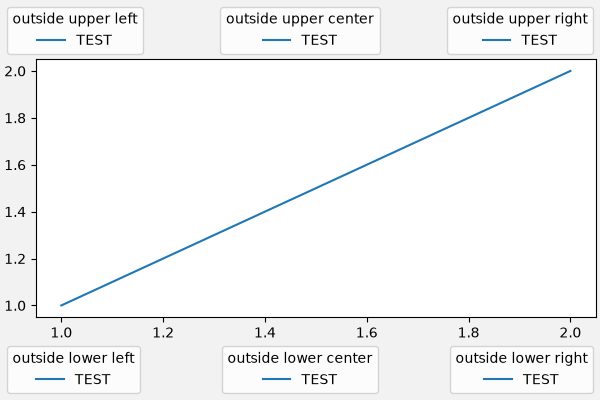
有时,按 Figure 或 SubFigure 定位图例,比相对于单个 Axes 定位更合适。使用 constrained layout,并让 loc 以 outside 开头,就能把图例绘制在 Axes 外部、Figure 或 SubFigure 范围内:
fig, axs = plt.subplot_mosaic([['left', 'right']], layout='constrained')

axs['left'].plot([1, 2, 3], label="test1")
axs['left'].plot([3, 2, 1], label="test2")

axs['right'].plot([1, 2, 3], 'C2', label="test3")
axs['right'].plot([3, 2, 1], 'C3', label="test4")
# Place a legend to the right of this smaller subplot.
fig.legend(loc='outside upper right')
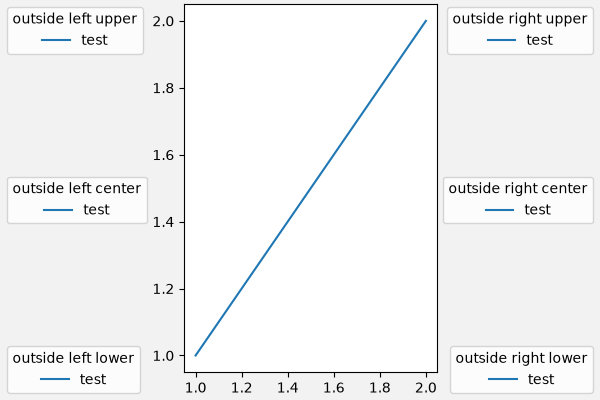
此处语法与普通 loc 略有不同,outside right upper 和 outside upper right 表示不同位置:
ucl = ['upper', 'center', 'lower']
lcr = ['left', 'center', 'right']
fig, ax = plt.subplots(figsize=(6, 4), layout='constrained', facecolor='0.95')

ax.plot([1, 2], [1, 2], label='TEST')
# Place a legend to the right of this smaller subplot.
for loc in [
        'outside upper left',
        'outside upper center',
        'outside upper right',
        'outside lower left',
        'outside lower center',
        'outside lower right']:
    fig.legend(loc=loc, title=loc)

fig, ax = plt.subplots(figsize=(6, 4), layout='constrained', facecolor='0.95')
ax.plot([1, 2], [1, 2], label='test')

for loc in [
        'outside left upper',
        'outside right upper',
        'outside left center',
        'outside right center',
        'outside left lower',
        'outside right lower']:
    fig.legend(loc=loc, title=loc)
同一 Axes 上放置多个图例
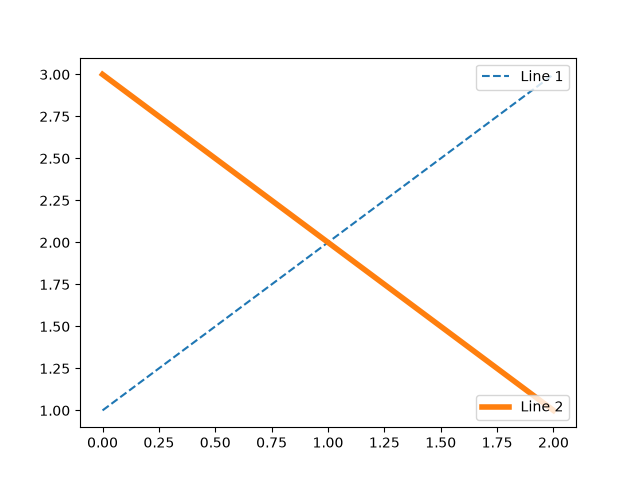
有时把条目分到多个图例更清楚。直觉上可能会多次调用 legend(),但最终 Axes 上仍只有一个图例。这是为了允许重复调用该函数,将图例更新为当前句柄。要保留旧图例实例,必须手动添加到 Axes:
fig, ax = plt.subplots()
line1, = ax.plot([1, 2, 3], label="Line 1", linestyle='--')
line2, = ax.plot([3, 2, 1], label="Line 2", linewidth=4)

# Create a legend for the first line.
first_legend = ax.legend(handles=[line1], loc='upper right')

# Add the legend manually to the Axes.
ax.add_artist(first_legend)

# Create another legend for the second line.
ax.legend(handles=[line2], loc='lower right')

plt.show()
图例处理器
创建条目时,句柄作为参数传给适当的 HandlerBase 子类。具体处理器按照以下规则选择:
- 使用关键字
handler_map的值更新get_legend_handler_map()。 - 检查句柄本身是否位于新的
handler_map中。 - 检查句柄的类型是否位于其中。
- 检查句柄类型的方法解析顺序,即 MRO 中的任何类型是否位于其中。
这套逻辑主要由 get_legend_handler() 实现。灵活的处理器机制为自定义图例键提供了必要的扩展入口。
最简单的自定义用法,是实例化已有的 legend_handler.HandlerBase 子类。例如,HandlerLine2D 接受 numpoints;为方便起见,legend() 也提供这个参数。随后将对象到处理器的映射传给 legend:
from matplotlib.legend_handler import HandlerLine2D

fig, ax = plt.subplots()
line1, = ax.plot([3, 2, 1], marker='o', label='Line 1')
line2, = ax.plot([1, 2, 3], marker='o', label='Line 2')

ax.legend(handler_map={line1: HandlerLine2D(numpoints=4)}, handlelength=4)
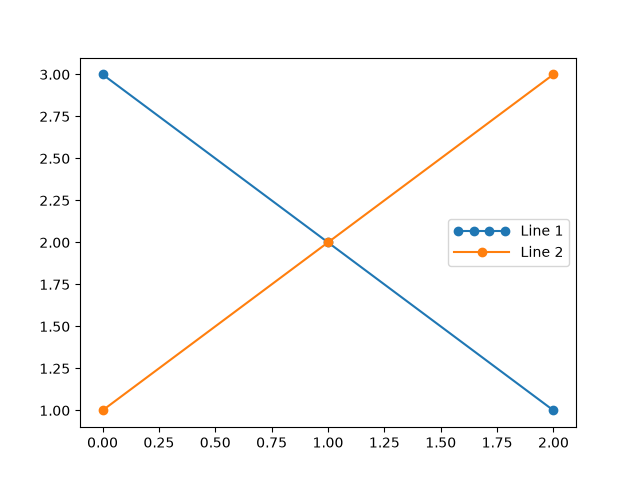
“Line 1”现在有四个标记点,“Line 2”仍使用原文示例中的默认两个点。还通过 handlelength 加长句柄,为更大的条目留出空间。
试着把映射的键从 line1 改为 type(line1),就会发现两个 Line2D 实例都使用四个标记。
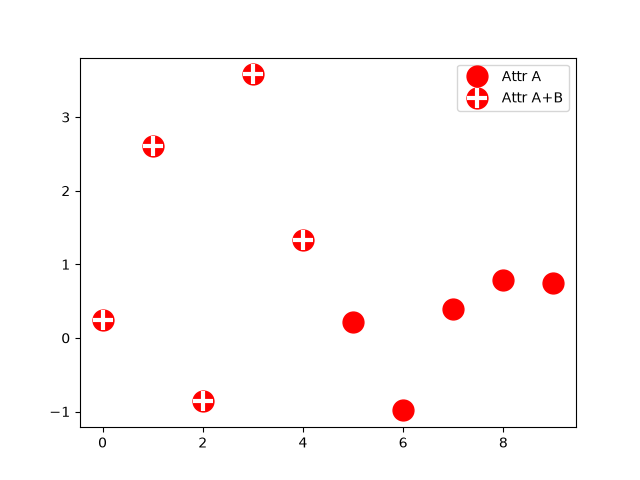
除了误差线、茎叶图、直方图等复杂图形的处理器,默认映射还有一个特殊的元组处理器 HandlerTuple,会把元组内的各句柄叠加。下面把两个图例键叠放:
from numpy.random import randn

z = randn(10)

fig, ax = plt.subplots()
red_dot, = ax.plot(z, "ro", markersize=15)
# Put a white cross over some of the data.
white_cross, = ax.plot(z[:5], "w+", markeredgewidth=3, markersize=15)

ax.legend([red_dot, (red_dot, white_cross)], ["Attr A", "Attr A+B"])
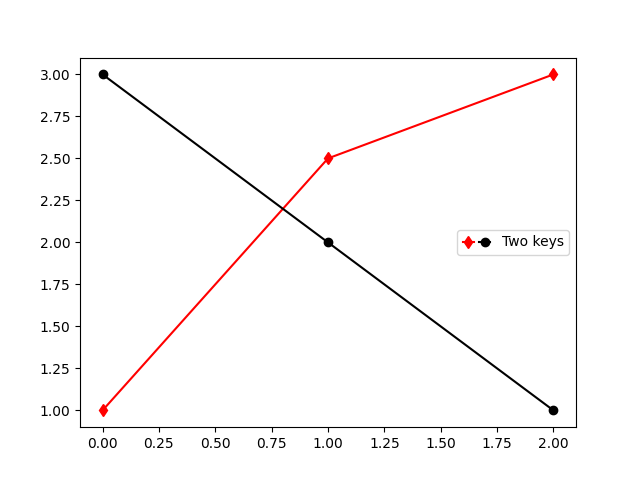
HandlerTuple 也可以把多个图例键分配给同一条目:
from matplotlib.legend_handler import HandlerLine2D, HandlerTuple

fig, ax = plt.subplots()
p1, = ax.plot([1, 2.5, 3], 'r-d')
p2, = ax.plot([3, 2, 1], 'k-o')

l = ax.legend([(p1, p2)], ['Two keys'], numpoints=1,
              handler_map={tuple: HandlerTuple(ndivide=None)})
实现自定义图例处理器
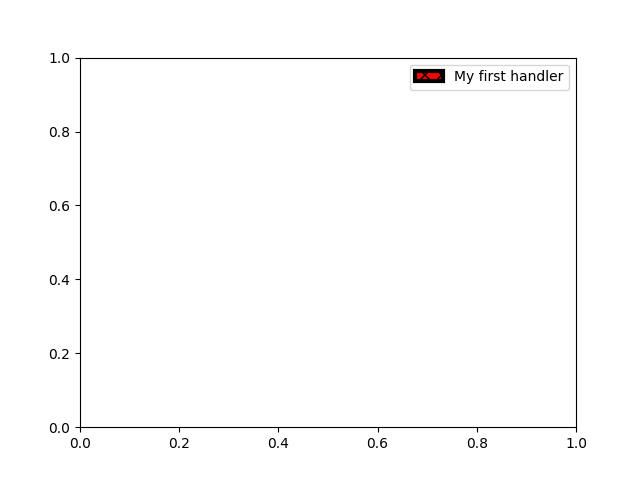
自定义处理器可以把任意句柄转成图例键,句柄甚至不必是 Matplotlib Artist。处理器必须实现 legend_artist,返回供图例使用的单个 Artist。方法签名见相应 API 文档。
import matplotlib.patches as mpatches


class AnyObject:
    pass


class AnyObjectHandler:
    def legend_artist(self, legend, orig_handle, fontsize, handlebox):
        x0, y0 = handlebox.xdescent, handlebox.ydescent
        width, height = handlebox.width, handlebox.height
        patch = mpatches.Rectangle([x0, y0], width, height, facecolor='red',
                                   edgecolor='black', hatch='xx', lw=3,
                                   transform=handlebox.get_transform())
        handlebox.add_artist(patch)
        return patch

fig, ax = plt.subplots()

ax.legend([AnyObject()], ['My first handler'],
          handler_map={AnyObject: AnyObjectHandler()})
如果希望全局支持 AnyObject,不必每次手动指定 handler_map,可以注册处理器:
from matplotlib.legend import Legend
Legend.update_default_handler_map({AnyObject: AnyObjectHandler()})
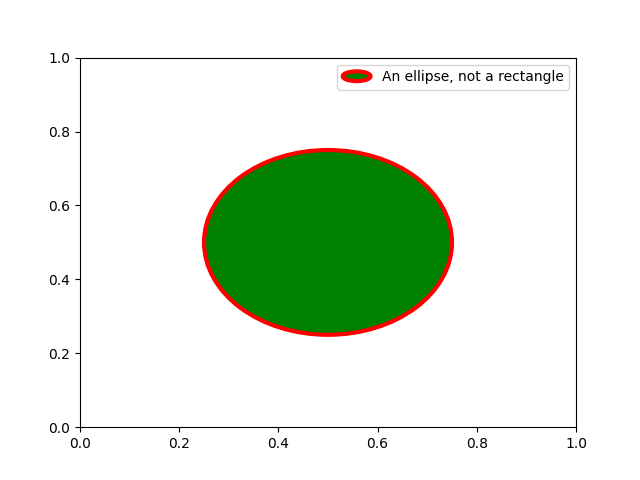
虽然自定义功能很强大,但已有处理器往往就能实现需求。例如,想把图例键从矩形改成椭圆:
from matplotlib.legend_handler import HandlerPatch


class HandlerEllipse(HandlerPatch):
    def create_artists(self, legend, orig_handle,
                       xdescent, ydescent, width, height, fontsize, trans):
        center = 0.5 * width - 0.5 * xdescent, 0.5 * height - 0.5 * ydescent
        p = mpatches.Ellipse(xy=center, width=width + xdescent,
                             height=height + ydescent)
        self.update_prop(p, orig_handle, legend)
        p.set_transform(trans)
        return [p]


c = mpatches.Circle((0.5, 0.5), 0.25, facecolor="green",
                    edgecolor="red", linewidth=3)

fig, ax = plt.subplots()

ax.add_patch(c)
ax.legend([c], ["An ellipse, not a rectangle"],
          handler_map={mpatches.Circle: HandlerEllipse()})
原文记录的脚本总运行时间为 0 分 7.014 秒。
原文图库由 Sphinx-Gallery 生成。
原文:Legend guide。作者/维护者:Matplotlib 文档贡献者。本文为原文的中文译文;代码保留原文内容。











暂无评论内容