


使用 DTrace 和 SystemTap 观测 CPython
作者:David Malcolm、Łukasz Langa。来源:Python 官方 HOWTO Instrumenting CPython with DTrace and SystemTap,并完整核对官方中文本地化页面。本次整理保留全部技术章节、探针表、C API 与示例,补齐中文页面仍为英文的说明,并明确标注代码修订。
DTrace 和 SystemTap 都是监控工具,可以帮助你了解计算机系统上的进程在做什么。它们各自使用领域专用语言,让用户编写脚本来筛选观测进程、从目标进程采集数据,并据此生成报告。
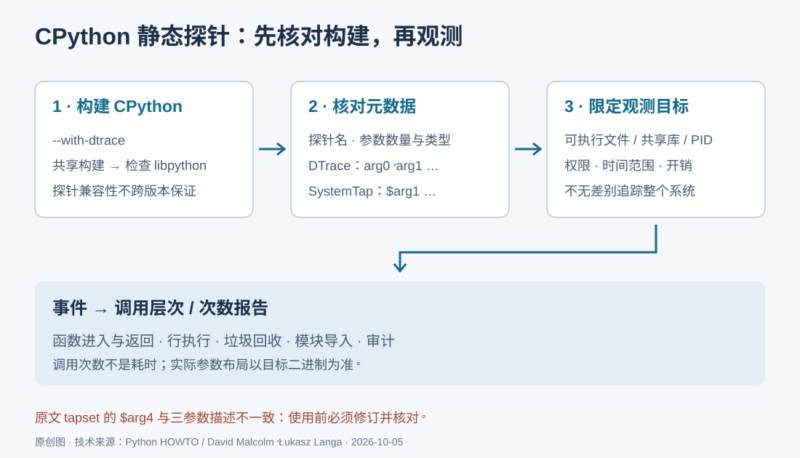
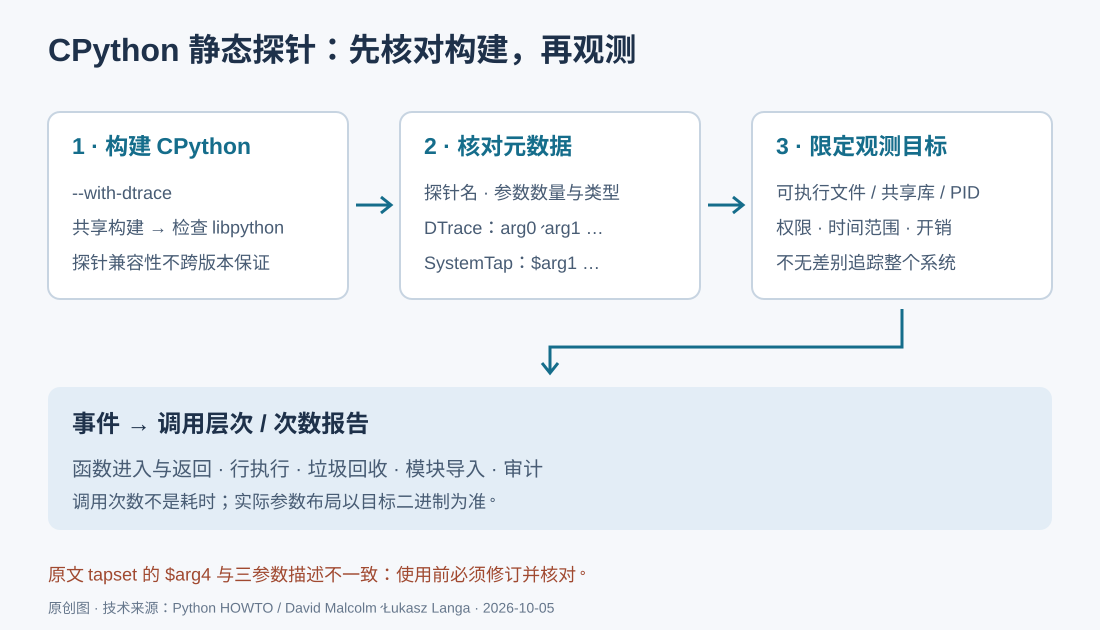
从 Python 3.6 开始,CPython 可以在构建时嵌入“标记”,也称“探针”。DTrace 或 SystemTap 脚本可以观察这些探针,使系统上的 CPython 进程更容易被监控。
CPython 实现细节:DTrace 标记属于 CPython 解释器的实现细节。不同 CPython 版本之间不保证探针兼容;升级版本后,脚本可能停止工作,也可能不发出警告就产生错误结果。本文核对的是 2026-10-09 复核时的 Python 3.14.8 文档页面(页面最近更新于 2026-10-07),但原文代码仍含 Python 3.3/3.6 的历史构建名称,不能直接视为当前机器路径。
启用静态标记
原文说明 macOS 提供内置 DTrace 支持。在 Linux 上,如果要把供 SystemTap 使用的标记嵌入 CPython,需要先安装 SystemTap 开发工具。原文列出以下两个发行版相关示例,按所用包管理器选择其一:
yum install systemtap-sdt-devel

# 使用 apt 的发行版示例
sudo apt-get install systemtap-sdt-dev
随后配置 CPython 构建时启用 --with-dtrace。配置检查应显示类似下面的结果;这是原文示例输出:
checking for --with-dtrace... yes在 macOS 上,可以先在后台启动 Python 进程,再列出该 Python provider 提供的探针。原文历史示例如下:
$ python3.6 -q &
$ sudo dtrace -l -P python$!  # 或:dtrace -l -m python3.6

   ID   PROVIDER            MODULE                          FUNCTION NAME
29564 python18035        python3.6          _PyEval_EvalFrameDefault function-entry
29565 python18035        python3.6             dtrace_function_entry function-entry
29566 python18035        python3.6          _PyEval_EvalFrameDefault function-return
29567 python18035        python3.6            dtrace_function_return function-return
29568 python18035        python3.6                           collect gc-done
29569 python18035        python3.6                           collect gc-start
29570 python18035        python3.6          _PyEval_EvalFrameDefault line
29571 python18035 python3.6 maybe_dtrace_line line审核补充:$! 指该 shell 最近一次后台启动的进程,必须确认它确实是你的目标;不要把示例 PID 或程序名照搬到其他环境。工具安装、探针能力和所需权限受操作系统与构建方式影响。不要为了套用此示例而关闭系统保护机制。
在 Linux 上,可以检查二进制文件是否有 .note.stapsdt 节,以确认是否包含 SystemTap 静态标记:
$ readelf -S ./python | grep .note.stapsdt
[30] .note.stapsdt        NOTE         0000000000000000 00308d78
如果用 --enable-shared 构建了 Python 共享库,就应检查共享库,而不是只看启动程序。原文给出的旧构建名称为:
$ readelf -S libpython3.3dm.so.1.0 | grep .note.stapsdt
[29] .note.stapsdt        NOTE         0000000000000000 00365b68
较新的 readelf 还可以输出探针元数据:
$ readelf -n ./python

Displaying notes found at file offset 0x00000254 with length 0x00000020:
    Owner                 Data size          Description
    GNU                  0x00000010          NT_GNU_ABI_TAG (ABI version tag)
        OS: Linux, ABI: 2.6.32

Displaying notes found at file offset 0x00000274 with length 0x00000024:
    Owner                 Data size          Description
    GNU                  0x00000014          NT_GNU_BUILD_ID (unique build ID bitstring)
        Build ID: df924a2b08a7e89f6e11251d4602022977af2670

Displaying notes found at file offset 0x002d6c30 with length 0x00000144:
    Owner                 Data size          Description
    stapsdt              0x00000031          NT_STAPSDT (SystemTap probe descriptors)
        Provider: python
        Name: gc__start
        Location: 0x00000000004371c3, Base: 0x0000000000630ce2, Semaphore: 0x00000000008d6bf6
        Arguments: -4@%ebx
    stapsdt              0x00000030          NT_STAPSDT (SystemTap probe descriptors)
        Provider: python
        Name: gc__done
        Location: 0x00000000004374e1, Base: 0x0000000000630ce2, Semaphore: 0x00000000008d6bf8
        Arguments: -8@%rax
    stapsdt              0x00000045          NT_STAPSDT (SystemTap probe descriptors)
        Provider: python
        Name: function__entry
        Location: 0x000000000053db6c, Base: 0x0000000000630ce2, Semaphore: 0x00000000008d6be8
        Arguments: 8@%rbp 8@%r12 -4@%eax
    stapsdt              0x00000046          NT_STAPSDT (SystemTap probe descriptors)
        Provider: python
        Name: function__return
        Location: 0x000000000053dba8, Base: 0x0000000000630ce2, Semaphore: 0x00000000008d6bea
        Arguments: 8@%rbp 8@%r12 -4@%eax
这些元数据告诉 SystemTap:应在机器代码中哪些预先安排的位置插入跟踪,从而启用脚本使用的钩子。这里的偏移、寄存器和地址都是原文构建的例子,应从实际二进制读取,不能当成跨版本常量。
静态 DTrace 探针
下面的 DTrace 脚本展示 Python 函数的进入、返回层次。它只在名为 start 的函数被调用期间跟踪,因此一般不会列出此前导入阶段发生的函数调用。
self int indent;

python$target:::function-entry
/copyinstr(arg1) == "start"/
{
        self->trace = 1;
}

python$target:::function-entry
/self->trace/
{
        printf("%d\t%*s:", timestamp, 15, probename);
        printf("%*s", self->indent, "");
        printf("%s:%s:%d\n", basename(copyinstr(arg0)), copyinstr(arg1), arg2);
        self->indent++;
}

python$target:::function-return
/self->trace/
{
        self->indent--;
        printf("%d\t%*s:", timestamp, 15, probename);
        printf("%*s", self->indent, "");
        printf("%s:%s:%d\n", basename(copyinstr(arg0)), copyinstr(arg1), arg2);
}

python$target:::function-return
/copyinstr(arg1) == "start"/
{
        self->trace = 0;
}
原文的调用方式如下。它会启动被跟踪的 Python 脚本;此处只展示命令,没有运行它:
$ sudo dtrace -q -s call_stack.d -c "python3.6 script.py"原文展示的输出为:
156641360502280  function-entry:call_stack.py:start:23
156641360518804  function-entry: call_stack.py:function_1:1
156641360532797  function-entry:  call_stack.py:function_3:9
156641360546807 function-return:  call_stack.py:function_3:10
156641360563367 function-return: call_stack.py:function_1:2
156641360578365  function-entry: call_stack.py:function_2:5
156641360591757  function-entry:  call_stack.py:function_1:1
156641360605556  function-entry:   call_stack.py:function_3:9
156641360617482 function-return:   call_stack.py:function_3:10
156641360629814 function-return:  call_stack.py:function_1:2
156641360642285 function-return: call_stack.py:function_2:6
156641360656770  function-entry: call_stack.py:function_3:9
156641360669707 function-return: call_stack.py:function_3:10
156641360687853  function-entry: call_stack.py:function_4:13
156641360700719 function-return: call_stack.py:function_4:14
156641360719640  function-entry: call_stack.py:function_5:18
156641360732567 function-return: call_stack.py:function_5:21
156641360747370 function-return:call_stack.py:start:28静态审核:示例用函数名而不是模块路径筛选 start,且只用一个开关管理跟踪区间。重名函数或递归调用 start 时,区间边界可能与预期不同;它不是任意程序的通用调用树采集器。-c 的内容是待启动命令,不应拼接不可信输入。
静态 SystemTap 标记
SystemTap 的底层用法,是直接引用静态标记,并明确指出标记所在的二进制文件。下面的脚本展示函数调用与返回的层次结构。
代码修订:原文这个代码块的格式串写作两个反斜杠加 n;本稿按逐行输出的意图,改成单个转义序列 \n。其他参数映射保持不变。
probe process("python").mark("function__entry") {
    filename = user_string($arg1);
    funcname = user_string($arg2);
    lineno = $arg3;

    printf("%s => %s in %s:%d\n",
           thread_indent(1), funcname, filename, lineno);
}

probe process("python").mark("function__return") {
    filename = user_string($arg1);
    funcname = user_string($arg2);
    lineno = $arg3;

    printf("%s <= %s in %s:%d\n",
           thread_indent(-1), funcname, filename, lineno);
}
原文调用方式如下:
$ stap \
  show-call-hierarchy.stp \
  -c "./python test.py"
原文输出示例:
11408 python(8274):        => __contains__ in Lib/_abcoll.py:362
11414 python(8274):         => __getitem__ in Lib/os.py:425
11418 python(8274):          => encode in Lib/os.py:490
11424 python(8274):          <= encode in Lib/os.py:493
11428 python(8274):         <= __getitem__ in Lib/os.py:426
11433 python(8274):        <= __contains__ in Lib/_abcoll.py:366
这些列依次表示:脚本开始后经过的微秒数、可执行文件名、进程 PID;后面的缩进和箭头表示执行中的调用、返回层次。
对于启用了 --enable-shared 的 CPython 构建,标记位于 libpython 共享库中,探针路径也必须相应改变。例如,把:
probe process("python").mark("function__entry") {改成原文中这个共享库形式;它假定使用 CPython 3.6 调试构建:
probe process("python").library("libpython3.6dm.so.1.0").mark("function__entry") {返回探针也必须定位到同一个实际库。库名、调试后缀和安装路径需要按本机构建核对。单独验证某个可执行文件含有探针,还不足以证明脚本选中了想跟踪的那个进程。
可用的静态标记
function__entry(str filename, str funcname, int lineno)- Python 函数开始执行时触发,仅针对纯 Python 字节码函数。SystemTap 中位置参数依次为
$arg1文件名、$arg2函数名、$arg3行号。前两者是const char *,用user_string()读取;行号是整数。 function__return(str filename, str funcname, int lineno)- 与进入标记相反,表示纯 Python 函数执行结束,无论是正常
return还是异常退出。参数与进入标记相同。 line(str filename, str funcname, int lineno)- 表示即将执行某一行 Python 代码,相当于分析器的逐行跟踪,不会在 C 函数内部触发。参数与函数进入标记相同。
gc__start(int generation)- 解释器开始一轮垃圾回收时触发。DTrace 的
arg0是准备扫描的代,与gc.collect()使用的概念一致。 gc__done(long collected)- 解释器完成一轮垃圾回收时触发。DTrace 的
arg0为回收对象的数量。 import__find__load__start(str modulename)importlib查找并加载模块之前触发。DTrace 的arg0是模块名称。Python 3.7 新增。import__find__load__done(str modulename, int found)importlib的find_and_load调用之后触发。DTrace 的arg0是模块名称,arg1表示是否成功加载。Python 3.7 新增。audit(str event, void *tuple)- 调用
sys.audit()或PySys_Audit()时触发。DTrace 的arg0是事件名的 C 字符串,arg1是指向元组对象的PyObject指针。Python 3.8 新增。
参数约定:不要混淆 DTrace 从 arg0 开始的编号与 SystemTap 静态标记的 $arg1 等编号。原文在不同段落使用不同工具的约定;实际数量、类型和布局必须与目标二进制元数据一致。audit 的元组参数是指针,不是可以直接作为字符串输出的内容。
C 入口点
为方便触发 DTrace 标记,Python 的 C API 提供与各静态标记对应的辅助函数。未启用 DTrace 的构建中,这些函数不做任何事情。通常不需要自行调用,因为 Python 已经负责触发它们。
| C API 函数 | 静态标记 | 备注 |
|---|---|---|
void PyDTrace_LINE(const char *arg0, const char *arg1, int arg2) |
line() |
|
void PyDTrace_FUNCTION_ENTRY(const char *arg0, const char *arg1, int arg2) |
function__entry() |
|
void PyDTrace_FUNCTION_RETURN(const char *arg0, const char *arg1, int arg2) |
function__return() |
|
void PyDTrace_GC_START(int arg0) |
gc__start() |
|
void PyDTrace_GC_DONE(Py_ssize_t arg0) |
gc__done() |
|
void PyDTrace_INSTANCE_NEW_START(int arg0) |
instance__new__start() |
未被 Python 使用 |
void PyDTrace_INSTANCE_NEW_DONE(int arg0) |
instance__new__done() |
未被 Python 使用 |
void PyDTrace_INSTANCE_DELETE_START(int arg0) |
instance__delete__start() |
未被 Python 使用 |
void PyDTrace_INSTANCE_DELETE_DONE(int arg0) |
instance__delete__done() |
未被 Python 使用 |
void PyDTrace_IMPORT_FIND_LOAD_START(const char *arg0) |
import__find__load__start() |
|
void PyDTrace_IMPORT_FIND_LOAD_DONE(const char *arg0, int arg1) |
import__find__load__done() |
|
void PyDTrace_AUDIT(const char *arg0, void *arg1) |
audit() |
C 层探针启用检查
对应的检查函数如下:
int PyDTrace_LINE_ENABLED(void);
int PyDTrace_FUNCTION_ENTRY_ENABLED(void);
int PyDTrace_FUNCTION_RETURN_ENABLED(void);
int PyDTrace_GC_START_ENABLED(void);
int PyDTrace_GC_DONE_ENABLED(void);
int PyDTrace_INSTANCE_NEW_START_ENABLED(void);
int PyDTrace_INSTANCE_NEW_DONE_ENABLED(void);
int PyDTrace_INSTANCE_DELETE_START_ENABLED(void);
int PyDTrace_INSTANCE_DELETE_DONE_ENABLED(void);
int PyDTrace_IMPORT_FIND_LOAD_START_ENABLED(void);
int PyDTrace_IMPORT_FIND_LOAD_DONE_ENABLED(void);
int PyDTrace_AUDIT_ENABLED(void);
每次调用 PyDTrace 函数之前,都必须使用相应的启用检查函数进行条件判断。这让 Python 在没有开启探针时尽量减少性能损耗。在未启用 DTrace 的构建中,这些检查函数不做其他事情,并返回 0。
SystemTap tapset
SystemTap 的高层用法是使用 tapset,它相当于一个库,把静态标记的一部分底层细节隐藏起来。原文的 tapset 基于非共享 CPython 构建,为函数进入和返回标记提供别名。
静态审核发现的原文不一致:上文列出的函数标记以及示例元数据都只有三个参数,但原文 tapset 还读取 frameptr = $arg4,并把 frameptr 列为别名参数。在只提供三个参数的构建上,不能照搬这行。本稿移除两处 $arg4 读取,使下面的修订示例与已列出的三个参数一致;并不据此承诺所有 CPython 构建均可运行。
/* 为 function__entry 和 function__return 提供高层封装。
   修订:仅使用本文元数据已声明的三个参数。 */
probe python.function.entry = process("python").mark("function__entry")
{
    filename = user_string($arg1);
    funcname = user_string($arg2);
    lineno = $arg3;
}
probe python.function.return = process("python").mark("function__return")
{
    filename = user_string($arg1);
    funcname = user_string($arg2);
    lineno = $arg3;
}
把 tapset 安装到 SystemTap 的 tapset 目录,例如 /usr/share/systemtap/tapset 后,便可使用这些额外探针点。是否安装到系统目录及所需权限,应由实际环境决定:
python.function.entry(str filename, str funcname, int lineno):表示纯 Python 字节码函数开始执行。python.function.return(str filename, str funcname, int lineno):与进入探针相反,表示函数正常返回或因异常结束。原文把它描述为与自身相反的笔误,在这里修正为“与进入探针相反”。
原文未经修订的两个签名还包括 frameptr;若你的实际构建另有第四个参数,必须先查明其含义,再决定是否增加该字段。
使用 tapset 的示例
有了上面的别名,调用层次跟踪脚本便不必直接引用底层静态标记:
probe python.function.entry
{
    printf("%s => %s in %s:%d\n",
           thread_indent(1), funcname, filename, lineno);
}

probe python.function.return
{
    printf("%s <= %s in %s:%d\n",
           thread_indent(-1), funcname, filename, lineno);
}
原文还给出一个类似 top 的视图:每秒统计所有匹配探针的运行中 CPython 代码,显示进入次数最多的前 20 个字节码帧。下面完整保留这种计数思路:
global fn_calls;

probe python.function.entry
{
    fn_calls[pid(), filename, funcname, lineno] += 1;
}

probe timer.ms(1000) {
    printf("\033[2J\033[1;1H"); /* 清屏 */
    printf("%6s %80s %6s %30s %6s\n",
           "PID", "FILENAME", "LINE", "FUNCTION", "CALLS");
    foreach ([pid, filename, funcname, lineno] in fn_calls- limit 20) {
        printf("%6d %80s %6d %30s %6d\n",
               pid, filename, lineno, funcname,
               fn_calls[pid, filename, funcname, lineno]);
    }
    delete fn_calls;
}
这个脚本按照 PID、文件名、函数名和行号分组累加,按计数降序显示前 20 条,再清空计数,为下一秒重新累计。这里衡量的是调用频次,不是 CPU 时间,也不是函数总耗时。实际可见范围取决于探针选择的可执行文件、库和目标进程,不能据此宣称覆盖所有版本、所有路径下的 Python 进程。
审核补充:原文的跨进程示例用于说明 tapset 复用;实际观测应限定经授权的进程与时间范围。高频函数事件或逐行探针可能增加开销,文件路径、函数名、导入名称和审计事件也可能暴露敏感上下文。不要在生产环境中无差别开启跟踪。本文示例未经现场运行验证:未安装工具、编译 CPython、加载探针或执行命令。
来源、许可和修订说明
Copyright © 2001 Python Software Foundation; All Rights Reserved。文档按 Python Software Foundation License Version 2 提供;文档示例、配方及其他代码还采用 Zero Clause BSD License。随交付保留 LICENSE-PSF.txt 许可文本。作者 David Malcolm、Łukasz Langa 及 Python 文档中文本地化贡献者的来源归属予以保留。
本文修订包括:整理中文表达、补译 C 探针检查说明、明确历史构建名称与 DTrace/SystemTap 参数编号差异、修正换行转义和 tapset 第四参数问题、修正返回探针描述笔误、补齐示例语句终止符,以及增加目标范围、开销与敏感信息说明。示例输出均来自原文,不是本文的测试结果。
本中文翻译与原创配图依据单独的发布授权提供;源文与示例代码仍适用各自列明的许可条件。






暂无评论内容