


在 Figure 中排列多个 Axes
一张图中经常需要同时放置多个 Axes,并且通常要将它们排成规则网格。随着库的发展,Matplotlib 提供了多种处理 Axes 网格的工具。这里介绍最推荐经常使用的工具、组织 Axes 的底层工具,并提及一些较早的工具。
注意
Matplotlib 中的 Axes 指包含数据、x轴和y轴、刻度、标签、标题等内容的绘图区域,详见Figure的组成部分。另一个常见术语“subplot”(子图)是指与其他 Axes 对象一起位于网格中的 Axes。
概览
创建网格形式的 Axes 组合
subplots-
这是创建 Figure 与 Axes 网格时主要使用的函数。它一次创建并放置所有 Axes,返回一个对象数组,其中包含网格中各 Axes 的引用。参见
Figure.subplots。
或者
subplot_mosaic-
这是创建 Figure 和 Axes 网格的简便方式,并允许 Axes 跨越行或列。返回的 Axes 保存在带标签的字典中,而不是数组中。另请参阅
Figure.subplot_mosaic及复杂且具有语义的Figure组合(subplot_mosaic)。
有时需要两组或多组相互独立的 Axes 网格,因此 Matplotlib 引入了SubFigure的概念:
SubFigure-
Figure 内部的虚拟 Figure。
底层工具
这些工具建立在GridSpec和SubplotSpec的概念之上:
GridSpec-
指定子图所在网格的几何结构,需要设置网格行数和列数。也可以调整子图布局参数,例如 left、right 等。
SubplotSpec-
指定子图在给定
GridSpec中的位置。
每次添加一个 Axes
上述函数通过一次调用创建所有 Axes。也可以一次添加一个 Axes,这也是 Matplotlib 最初采用的方式。这样做通常不够简洁或灵活,但在交互式工作或需要将 Axes 放到自定义位置时仍有用:
add_axes-
按照
[left, bottom, width, height]指定的位置添加单个 Axes;这些数值分别以 Figure 宽度或高度的比例表示。 subplot或Figure.add_subplot-
向 Figure 添加一个子图,索引从1开始,沿用 Matlab 的习惯。通过指定一组网格单元,可以让子图跨越多列或多行。
subplot2grid-
与
pyplot.subplot类似,但索引从0开始,并通过 Python 二维切片选择单元格。
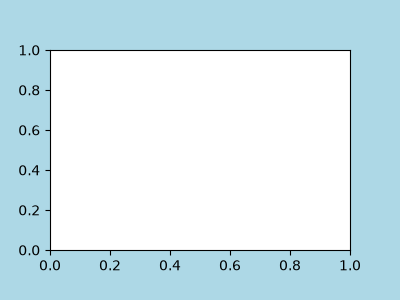
作为手动添加 Axes 的简单例子,在4英寸×3英寸的 Figure 中添加一个3英寸×2英寸的 Axes ax。子图位置以 Figure 归一化单位表示为 [left, bottom, width, height]:
import matplotlib.pyplot as plt
import numpy as np

w, h = 4, 3
margin = 0.5
fig = plt.figure(figsize=(w, h), facecolor='lightblue')
ax = fig.add_axes((margin / w, margin / h,
                   (w - 2 * margin) / w, (h - 2 * margin) / h))
创建网格的高级接口
基本的2×2网格
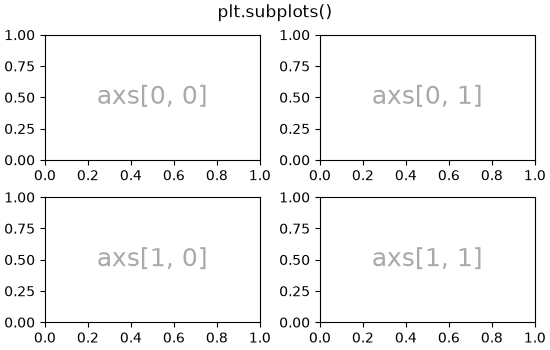
使用subplots可以创建基本的2×2 Axes 网格。它返回一个Figure实例和一个Axes对象数组。通过 Axes 对象的方法可以向绘图区域放置各种 artist;这里使用annotate,其他方法包括plot、pcolormesh等。
fig, axs = plt.subplots(ncols=2, nrows=2, figsize=(5.5, 3.5),
                        layout="constrained")
# add an artist, in this case a nice label in the middle...
for row in range(2):
    for col in range(2):
        axs[row, col].annotate(f'axs[{row}, {col}]', (0.5, 0.5),
                               transform=axs[row, col].transAxes,
                               ha='center', va='center', fontsize=18,
                               color='darkgrey')
fig.suptitle('plt.subplots()')
接下来需要给很多 Axes 加注释,因此把注释操作封装起来,避免每次都重复大量注释代码:
def annotate_axes(ax, text, fontsize=18):
    ax.text(0.5, 0.5, text, transform=ax.transAxes,
            ha="center", va="center", fontsize=fontsize, color="darkgrey")
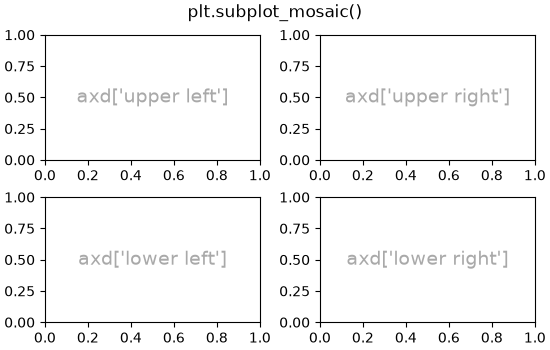
subplot_mosaic可以达到同样效果,但返回的是字典而不是数组,用户可以为字典键赋予有意义的名称。这里提供两个列表,每个列表代表一行,每个元素是代表该列的键。
fig, axd = plt.subplot_mosaic([['upper left', 'upper right'],
                               ['lower left', 'lower right']],
                              figsize=(5.5, 3.5), layout="constrained")
for k, ax in axd.items():
    annotate_axes(ax, f'axd[{k!r}]', fontsize=14)
fig.suptitle('plt.subplot_mosaic()')
固定纵横比的 Axes 网格
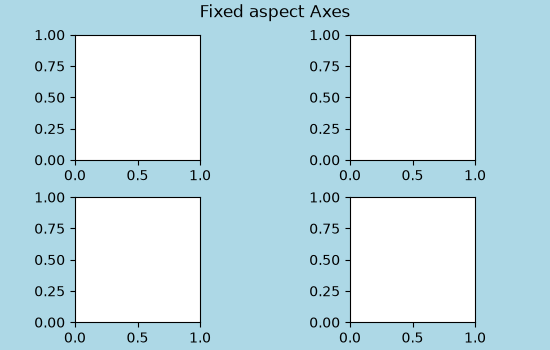
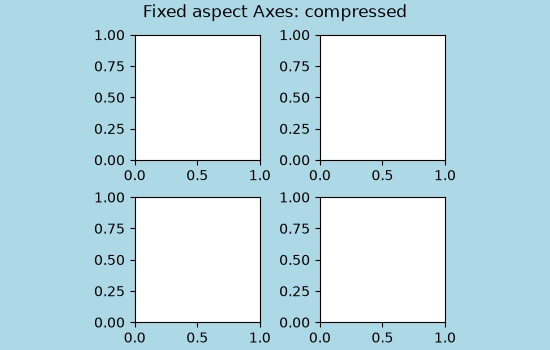
图片和地图经常使用固定纵横比的 Axes。但这种布局存在难点:Axes 大小同时受两类约束,一方面要装进 Figure,另一方面要保持指定纵横比。因此默认情况下,Axes 之间可能出现较大的空隙:
fig, axs = plt.subplots(2, 2, layout="constrained",
                        figsize=(5.5, 3.5), facecolor='lightblue')
for ax in axs.flat:
    ax.set_aspect(1)
fig.suptitle('Fixed aspect Axes')
一种解决办法是把 Figure 的纵横比调整到接近 Axes 的纵横比,但需要反复尝试。Matplotlib 还提供layout="compressed",可以减少简单网格中 Axes 之间的空隙。mpl_toolkits中的ImageGrid也能实现类似效果,不过使用的是非标准 Axes 类。
fig, axs = plt.subplots(2, 2, layout="compressed", figsize=(5.5, 3.5),
                        facecolor='lightblue')
for ax in axs.flat:
    ax.set_aspect(1)
fig.suptitle('Fixed aspect Axes: compressed')
让 Axes 跨越网格的多行或多列
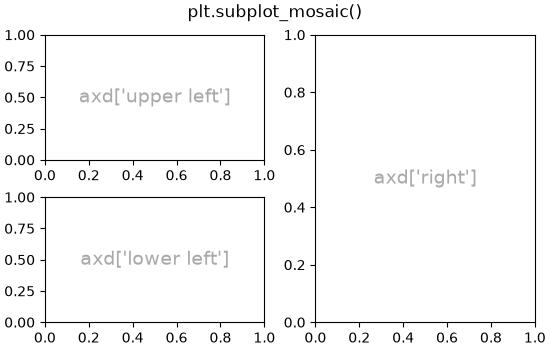
有时需要让一个 Axes 跨越多行或多列。实现方式有多种,最方便的方式通常是使用subplot_mosaic,并重复其中某个键:
fig, axd = plt.subplot_mosaic([['upper left', 'right'],
                               ['lower left', 'right']],
                              figsize=(5.5, 3.5), layout="constrained")
for k, ax in axd.items():
    annotate_axes(ax, f'axd[{k!r}]', fontsize=14)
fig.suptitle('plt.subplot_mosaic()')
下文也介绍如何通过GridSpec或subplot2grid实现同样效果。
网格中不同的列宽或行高
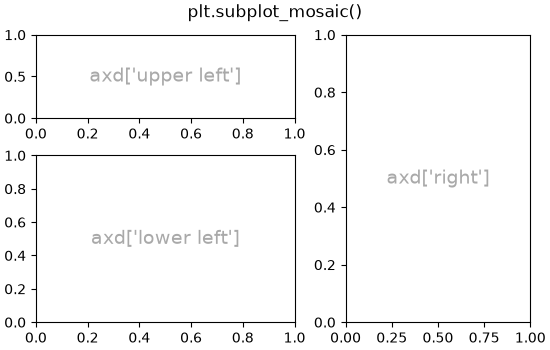
subplots和subplot_mosaic都允许通过 gridspec_kw 关键字参数,为网格各行设置不同高度、为各列设置不同宽度。GridSpec接受的间距参数也可以传给subplots和subplot_mosaic:
gs_kw = dict(width_ratios=[1.4, 1], height_ratios=[1, 2])
fig, axd = plt.subplot_mosaic([['upper left', 'right'],
                               ['lower left', 'right']],
                              gridspec_kw=gs_kw, figsize=(5.5, 3.5),
                              layout="constrained")
for k, ax in axd.items():
    annotate_axes(ax, f'axd[{k!r}]', fontsize=14)
fig.suptitle('plt.subplot_mosaic()')
嵌套 Axes 布局
有时需要两组或多组不必彼此关联的 Axes 网格。最简单的方法是使用Figure.subfigures。各子 Figure 的布局相互独立,因此它们的 Axes 边框不一定对齐。下文还介绍如何通过写法更复杂的GridSpecFromSubplotSpec实现相同效果。
fig = plt.figure(layout="constrained")
subfigs = fig.subfigures(1, 2, wspace=0.07, width_ratios=[1.5, 1.])
axs0 = subfigs[0].subplots(2, 2)
subfigs[0].set_facecolor('lightblue')
subfigs[0].suptitle('subfigs[0]\nLeft side')
subfigs[0].supxlabel('xlabel for subfigs[0]')

axs1 = subfigs[1].subplots(3, 1)
subfigs[1].suptitle('subfigs[1]')
subfigs[1].supylabel('ylabel for subfigs[1]')
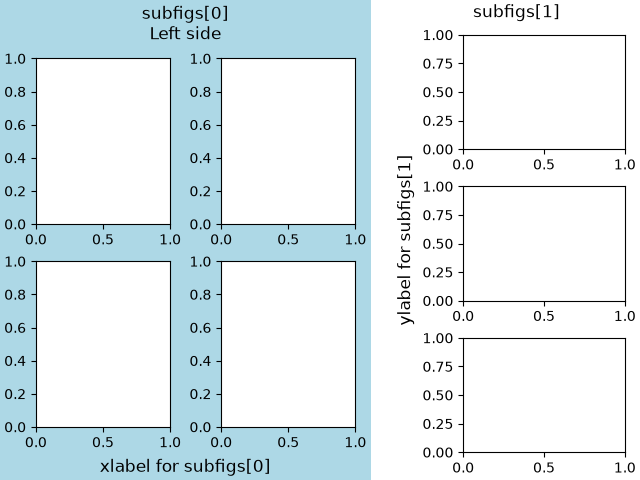
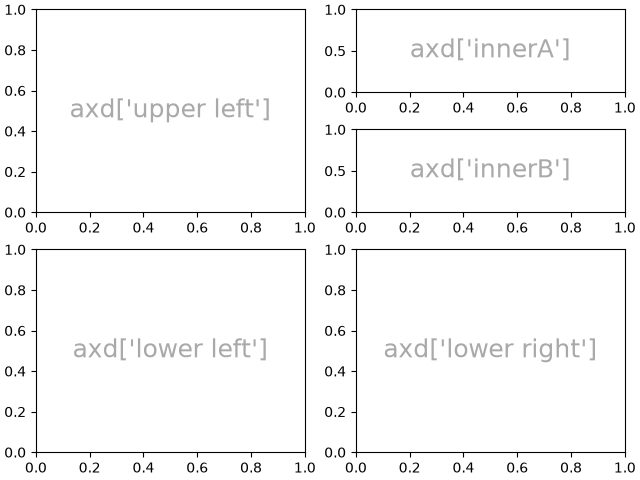
也可以向subplot_mosaic传入嵌套列表来嵌套 Axes。这种方式不像上一种方式那样使用子 Figure,因此不能分别为每个子 Figure 添加suptitle、supxlabel等内容。它实际是对下文介绍的subgridspec方法提供的一层方便封装。
inner = [['innerA'],
         ['innerB']]
outer = [['upper left',  inner],
          ['lower left', 'lower right']]

fig, axd = plt.subplot_mosaic(outer, layout="constrained")
for k, ax in axd.items():
    annotate_axes(ax, f'axd[{k!r}]')
底层与高级网格方法
在内部,Axes 网格的排列由GridSpec和SubplotSpec实例控制。GridSpec 定义一组网格单元,这些单元不必大小一致。对 GridSpec 进行索引会返回一个覆盖一个或多个单元的 SubplotSpec,用于指定 Axes 的位置。
下面的例子展示如何用 GridSpec 对象,通过底层方法排列 Axes。
基本的2×2网格
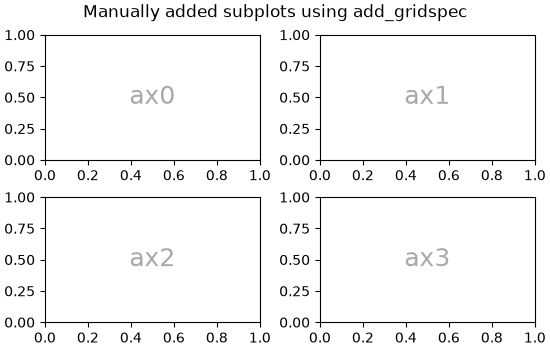
可以用以下方式实现与plt.subplots(2, 2)相同的2×2网格:
fig = plt.figure(figsize=(5.5, 3.5), layout="constrained")
spec = fig.add_gridspec(ncols=2, nrows=2)

ax0 = fig.add_subplot(spec[0, 0])
annotate_axes(ax0, 'ax0')

ax1 = fig.add_subplot(spec[0, 1])
annotate_axes(ax1, 'ax1')

ax2 = fig.add_subplot(spec[1, 0])
annotate_axes(ax2, 'ax2')

ax3 = fig.add_subplot(spec[1, 1])
annotate_axes(ax3, 'ax3')

fig.suptitle('Manually added subplots using add_gridspec')
让 Axes 跨越网格单元或多行
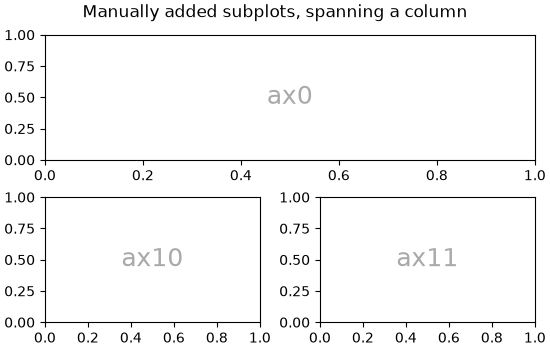
可以用NumPy切片语法对 spec 数组进行索引,新 Axes 会覆盖该切片。这与fig, axd = plt.subplot_mosaic([['ax0', 'ax0'], ['ax1', 'ax2']], ...)相同:
fig = plt.figure(figsize=(5.5, 3.5), layout="constrained")
spec = fig.add_gridspec(2, 2)

ax0 = fig.add_subplot(spec[0, :])
annotate_axes(ax0, 'ax0')

ax10 = fig.add_subplot(spec[1, 0])
annotate_axes(ax10, 'ax10')

ax11 = fig.add_subplot(spec[1, 1])
annotate_axes(ax11, 'ax11')

fig.suptitle('Manually added subplots, spanning a column')
手动调整 GridSpec 布局
显式使用 GridSpec 时,可以调整由它创建的子图的布局参数。该方式与 constrained layout 或Figure.tight_layout不兼容:这两种自动布局会忽略 left 和 right,并调整子图大小以填满 Figure。手动放置通常需要反复调整,避免 Axes 的刻度标签与绘图区域重叠。
这些间距参数也可以作为 gridspec_kw 参数传给subplots和subplot_mosaic。
fig = plt.figure(layout=None, facecolor='lightblue')
gs = fig.add_gridspec(nrows=3, ncols=3, left=0.05, right=0.75,
                      hspace=0.1, wspace=0.05)
ax0 = fig.add_subplot(gs[:-1, :])
annotate_axes(ax0, 'ax0')
ax1 = fig.add_subplot(gs[-1, :-1])
annotate_axes(ax1, 'ax1')
ax2 = fig.add_subplot(gs[-1, -1])
annotate_axes(ax2, 'ax2')
fig.suptitle('Manual gridspec with right=0.75')

使用 SubplotSpec 创建嵌套布局
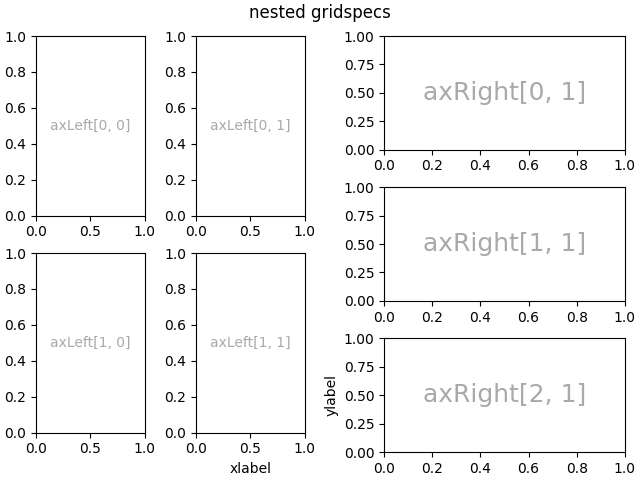
使用subgridspec可以创建与subfigures类似的嵌套布局。在这种情况下,Axes 边框会对齐。
写法更复杂的gridspec.GridSpecFromSubplotSpec同样提供这个功能。
fig = plt.figure(layout="constrained")
gs0 = fig.add_gridspec(1, 2)

gs00 = gs0[0].subgridspec(2, 2)
gs01 = gs0[1].subgridspec(3, 1)

for a in range(2):
    for b in range(2):
        ax = fig.add_subplot(gs00[a, b])
        annotate_axes(ax, f'axLeft[{a}, {b}]', fontsize=10)
        if a == 1 and b == 1:
            ax.set_xlabel('xlabel')
for a in range(3):
    ax = fig.add_subplot(gs01[a])
    annotate_axes(ax, f'axRight[{a}, {b}]')
    if a == 2:
        ax.set_ylabel('ylabel')

fig.suptitle('nested gridspecs')
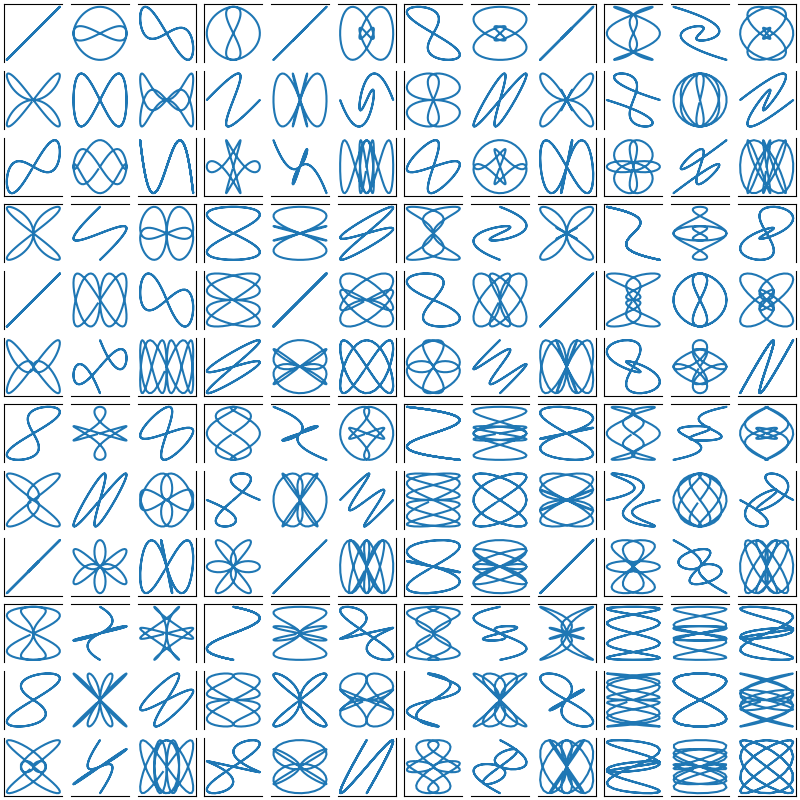
下面是更复杂的嵌套 GridSpec 示例:外层创建4×4网格,每个单元内包含3×3的 Axes 网格。通过隐藏各内层3×3网格中适当的边框,勾勒出外层4×4网格。
def squiggle_xy(a, b, c, d, i=np.arange(0.0, 2*np.pi, 0.05)):
    return np.sin(i*a)*np.cos(i*b), np.sin(i*c)*np.cos(i*d)

fig = plt.figure(figsize=(8, 8), layout='constrained')
outer_grid = fig.add_gridspec(4, 4, wspace=0, hspace=0)

for a in range(4):
    for b in range(4):
        # gridspec inside gridspec
        inner_grid = outer_grid[a, b].subgridspec(3, 3, wspace=0, hspace=0)
        axs = inner_grid.subplots()  # Create all subplots for the inner grid.
        for (c, d), ax in np.ndenumerate(axs):
            ax.plot(*squiggle_xy(a + 1, b + 1, c + 1, d + 1))
            ax.set(xticks=[], yticks=[])

# show only the outside spines
for ax in fig.get_axes():
    ss = ax.get_subplotspec()
    ax.spines.top.set_visible(ss.is_first_row())
    ax.spines.bottom.set_visible(ss.is_last_row())
    ax.spines.left.set_visible(ss.is_first_col())
    ax.spines.right.set_visible(ss.is_last_col())

plt.show()
延伸阅读
参考接口
本示例展示了以下函数、方法、类和模块的用法:
原文示例脚本总运行时间:0分19.196秒。











暂无评论内容