


原作者/来源:SciPy 文档贡献者/The SciPy community(原页无单独作者署名)。原文:Levene test for equal variances。本文为经授权的中文译稿;技术核验日期:2026-10-05。
Levene 检验(scipy.stats.levene)检验的零假设是:所有输入样本都来自方差相等的总体。如果数据明显偏离正态分布,Levene 检验可以作为 Bartlett 检验(scipy.stats.bartlett)的替代方法。
从三组牙齿生长观测开始
参考文献 [1] 研究了维生素 C 对豚鼠牙齿生长的影响。一个对照研究把 60 个实验对象分成小剂量、中剂量和大剂量三组,每天分别给予 0.5、1.0 和 2.0 毫克维生素 C,42 天后测量牙齿生长量。以下 small_dose、medium_dose 和 large_dose 数组记录三组的测量值;原教程将单位标为微米。
import numpy as np
small_dose = np.array([
    4.2, 11.5, 7.3, 5.8, 6.4, 10, 11.2, 11.2, 5.2, 7,
    15.2, 21.5, 17.6, 9.7, 14.5, 10, 8.2, 9.4, 16.5, 9.7
])
medium_dose = np.array([
    16.5, 16.5, 15.2, 17.3, 22.5, 17.3, 13.6, 14.5, 18.8, 15.5,
    19.7, 23.3, 23.6, 26.4, 20, 25.2, 25.8, 21.2, 14.5, 27.3
])
large_dose = np.array([
    23.6, 18.5, 33.9, 25.5, 26.4, 32.5, 26.7, 21.5, 23.3, 29.5,
    25.5, 26.4, 22.4, 24.5, 24.8, 30.9, 26.4, 27.3, 29.4, 23
])
scipy.stats.levene 返回的统计量对样本之间的方差差异敏感:
from scipy import stats
res = stats.levene(small_dose, medium_dose, large_dose)
res.statisticnp.float64(0.6457341109631506)方差差异较大时,统计量通常也较大。要检验各组方差是否不等,可以把观测到的统计量与零分布比较。这里的零分布,是在“三个总体方差相等”这一零假设下得到的统计量分布。
画出渐近零分布和右尾面积
本检验使用 F 分布近似零分布。三组样本共 60 条观测,因此分子自由度为 2,分母自由度为 57:
import matplotlib.pyplot as plt
k, n = 3, 60   # number of samples, total number of observations
dist = stats.f(dfn=k-1, dfd=n-k)
val = np.linspace(0, 5, 100)
pdf = dist.pdf(val)
fig, ax = plt.subplots(figsize=(8, 5))

def plot(ax):  # we'll reuse this
    ax.plot(val, pdf, color='C0')
    ax.set_title("Levene Test Null Distribution")
    ax.set_xlabel("statistic")
    ax.set_ylabel("probability density")
    ax.set_xlim(0, 5)
    ax.set_ylim(0, 1)

plot(ax)
plt.show()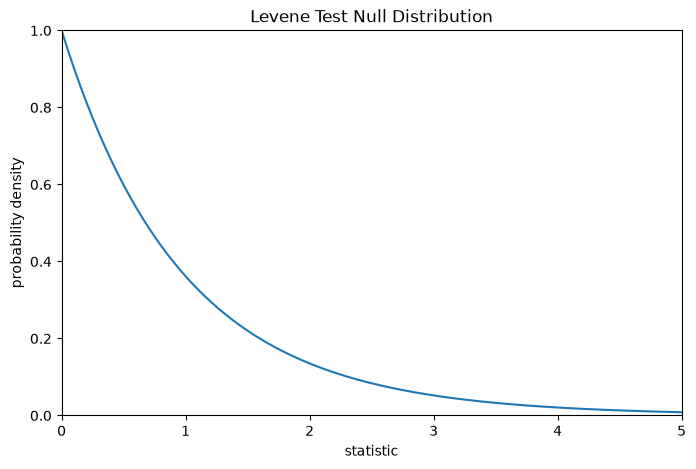
p 值把这种比较量化:它等于零分布中统计量大于或等于实际观测值的概率。调用生存函数 sf 可以得到右尾概率:
fig, ax = plt.subplots(figsize=(8, 5))
plot(ax)
pvalue = dist.sf(res.statistic)
annotation = (f'p-value={pvalue:.3f}\n(shaded area)')
props = dict(facecolor='black', width=1, headwidth=5, headlength=8)
_ = ax.annotate(annotation, (1.5, 0.22), (2.25, 0.3), arrowprops=props)
i = val >= res.statistic
ax.fill_between(val[i], y1=0, y2=pdf[i], color='C0')
plt.show()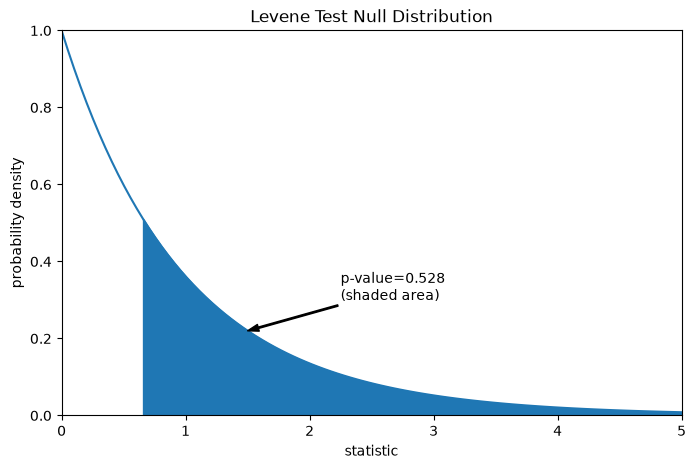
res.pvaluenp.float64(0.5280694573759913)如果 p 值很“小”,也就是在总体方差相等的条件下,得到这么极端的统计量的概率很低,就可以把它视为反对零假设、支持“各组方差不相等”这一备择假设的证据。解释结果时必须注意:
- 反过来不成立:这个检验不能提供“零假设成立”的证据。p 值不小,不等于证明方差相等。
- 哪些 p 值算“小”,应当在分析数据之前确定 [2],同时考虑假阳性(错误拒绝零假设)和假阴性(没有拒绝实际为假的零假设)的风险。
- 小 p 值不是效应很大的证据;它只能支持统计上的“显著”,即这样的结果在零假设下不容易出现。
用置换构造随机零分布
F 分布只是零分布的渐近近似。样本较小时,置换检验有时更合适。在“三组样本都来自同一个总体”的零假设下,每个观测值出现在任意一组中的可能性相同。因此,可以反复把全部观测随机分配到三组,再计算统计量,形成随机零分布。
def statistic(*samples):
    return stats.levene(*samples).statistic
ref = stats.permutation_test(
    (small_dose, medium_dose, large_dose), statistic,
    permutation_type='independent', alternative='greater'
)
fig, ax = plt.subplots(figsize=(8, 5))
plot(ax)
bins = np.linspace(0, 5, 25)
ax.hist(
    ref.null_distribution, bins=bins, density=True, facecolor="C1"
)
ax.legend(['asymptotic approximation\n(many observations)',
           'randomized null distribution'])
plot(ax)
plt.show()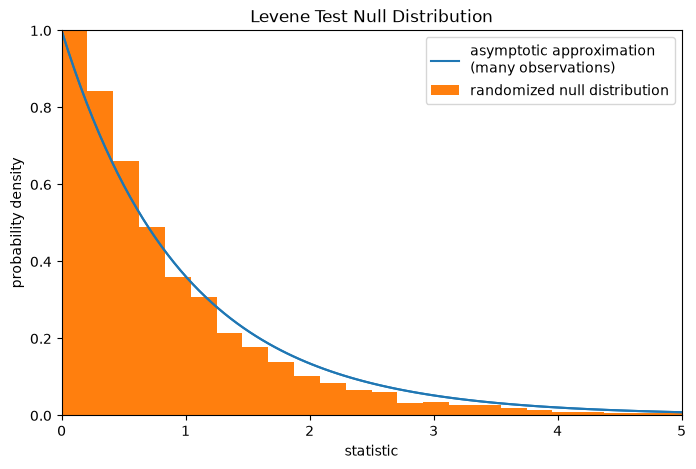
ref.pvalue # randomized test p-valuenp.float64(0.4483)原文这里得到的随机检验 p 值为 0.4483,与前面 scipy.stats.levene 返回的渐近结果存在明显差异。置换检验能够严格支持哪些统计推断,也受到前提条件的限制;不过,在不少情形下,它仍可能是更合适的方法 [3]。
参考文献
- Bliss, C. I.(1952),The Statistics of Bioassay: With Special Reference to the Vitamins,第 499–503 页。DOI:10.1016/C2013-0-12584-6。
- Phipson, B. 与 Smyth, G. K.(2010),“Permutation P-values Should Never Be Zero: Calculating Exact P-values When Permutations Are Randomly Drawn.” Statistical Applications in Genetics and Molecular Biology 9.1。
- Ludbrook, J. 与 Dudley, H.(1998),“Why permutation tests are superior to t and F tests in biomedical research.” The American Statistician,52(2),127–132。
来源与权利说明:保留原页声明“© Copyright 2008, The SciPy community.”。页面未单列本文转载许可证;不以软件许可替代文档授权。











暂无评论内容